
An average FileMaker database contains a large amount of unused, valuable data. And that data can provide a lot of important insights. How long does it take to ship an order? What is our most popular product? What categories are more profitable than others?
All of these and more are important questions that can be answered in a matter of minutes in Tableau. The best part? Unlike Microsoft Power BI, Tableau has a special FileMaker connector that can be used to easily get that data. With their new flexible pricing and Tableau Desktop 2021’s visualizing power, it’s easier to get the answers you need to help grow and improve your business.
FileMaker Data in Tableau
To visualize your FileMaker data in Tableau, the first step is to get that data from FileMaker. Luckily, it’s easy to set up and use using this Claris guide. The most important thing to remember here is security — always create a new account for API connections and don’t forget to enable the fmrest extended privilege set.
Keep in mind that Tableau is connecting to layouts, not tables, so it’s a good practice to create separate FileMaker layouts for Tableau and expose only those fields that you need for visualization. Note: the fields that are not on the layout won’t appear in Tableau. The upside is that by limiting the fields you expose, you can prevent Tableau from slowing down for larger tables. Another thing to be cautious about is renaming objects. Renaming the field in FileMaker won’t break the visualization; the Tableau chart will keep referencing the old name. However, if the layout used in a Tableau report is renamed in FileMaker, the connection breaks. Alternatively, you can freely rename layouts and fields in Tableau — their names in FileMaker won’t change.
You also might like: The Best 20 Data Analytics Tools
Relationships vs. Joins
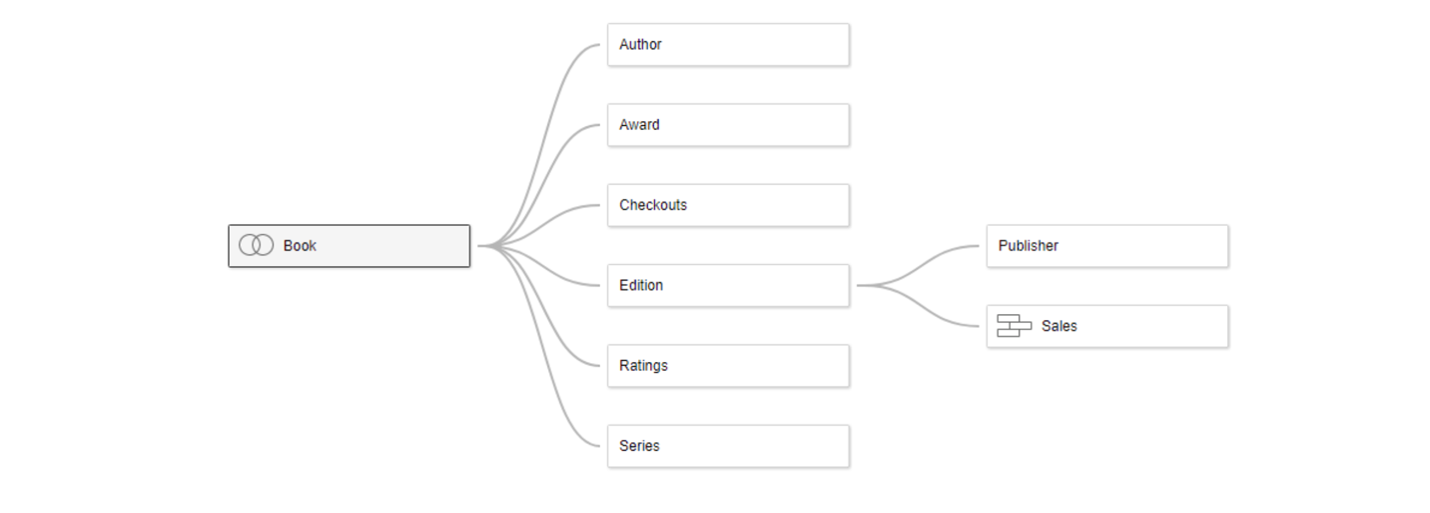
Most of the time, all of your data won’t live in one FileMaker table. Instead, you’ll have to make multiple connections to different layouts and then connect them just like you would manage relationships in FileMaker. The relationships in Tableau are pretty new but they work the same way – as a contract between two related tables. In the example below, each block would be a separate FileMaker table and you would need nine connections to different layouts to bring all of this data in.
Before relationships were introduced, Tableau used joins so it’s not uncommon to still see them mentioned in the documentation. You won’t need joins for the purposes of this article, but here is a helpful guide from Tableau if you want to learn more about them.
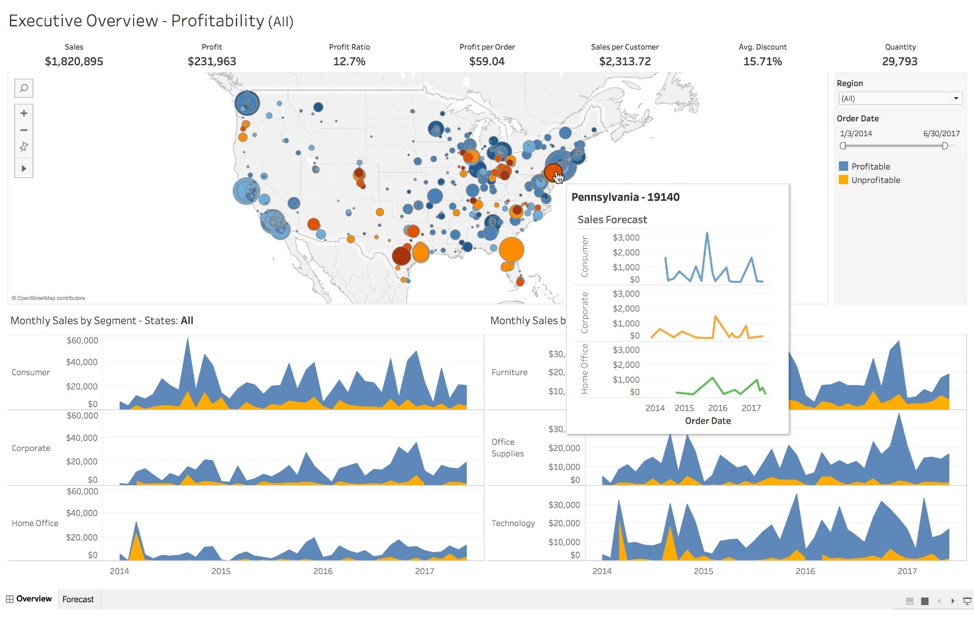
Tell the Story with FileMaker and Tableau
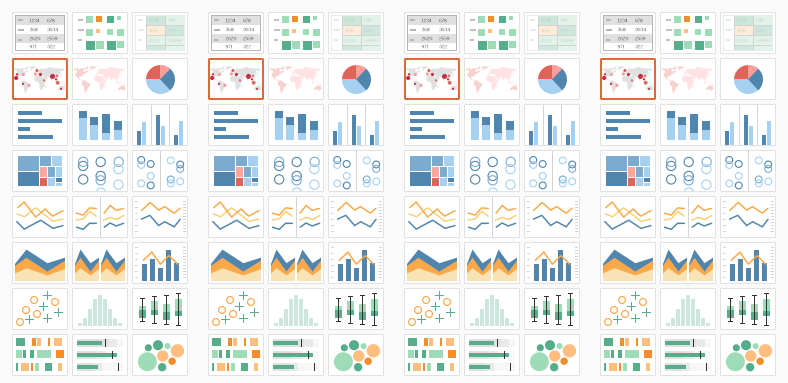
Once you have your data in Tableau, it’s time to tell the story. Pictures and visualizations have a more powerful impact on their audience than written words. While it’s tempting to just throw some data on the screen and use table views for everything, try to use charts when possible. Most of the time, even a simple bar chart can highlight the trends better than a detailed table view. For inspiration, we would recommend checking out the Tableau Public website or start with the Show Me menu that can be found in the upper right corner of the Tableau Desktop.
Actions, filters, and fmpurls
DataThe true power of Tableau rests on its ability to use filters, highlights, and actions to slice and dice the data. This allows you to build complex dashboards with multiple views and see a detailed data drill down. Even better, one of the actions, Go to URL, can be used to open a FileMaker application, set variables, and even run scripts. If you’re not familiar with fmpurls, check out this guide from Claris.

Tableau is constantly improving its product, and recently, it changed its licensing requirements, making it a more affordable option for small businesses. In a nutshell, to get started, you’ll need a creator license, Tableau Desktop to create visualizations, and, optionally, a place to host your charts (Tableau Online or Tableau Server). The hosted charts created in Tableau can be viewed in a browser or directly in FileMaker using a web viewer. In both cases, they are responsive, fast, and can be further customized using an extensive Tableau JavaScript API. (This model resembles the way FileMaker works when you use a FileMaker Desktop application to create and can either use your system locally or host it on a FileMaker server to collaborate with others.)
At first, it might seem difficult to navigate Tableau products’ world and see how it can be seamlessly integrated with FileMaker. But after a short while, and once you create your first beautiful visualization, it will become more obvious that FileMaker and Tableau are a perfect duo – made for each other!
We hope you enjoyed learning more about how to visualize your FileMaker data in Tableau. Want to dive into the world of data analysis? Catch up on our post – Data for Decision Making.
Subscribe to get the latest in your inbox.

Built with you in mind
Speak to one of our expert consultants about making sense of your data today. During
this free consultation, we'll address your questions, learn more about your business, and
make some immediate recommendations.