
- 1. Augmented and Virtual Reality (AR/VR): Beyond the 2-D Space
- 2. AI-Driven Visualizations: Letting Machines Guide the Way
- 3. Real-time Data Streams: The Dynamic Face of Data
- 4. Quantum Computing and Data Visualization
- 5. Neural Interface and Data Visualization
- 6. Simplified User Interfaces
- 7. Interactive Data Visualization Is Also a Trend
- 8. Integrated Data Visualization Tools
- 9. Social Media and Data Visualization Content
- Charting the Future of Data Visualization
- Read more
Data visualization trends include immersive AR/VR visualizations and real-time data processing through IoT and edge computing. Additionally, quantum computing promises to revolutionize the speed of complex visualizations Learn more about it and meet other trends.
Effective data presentation is essential for decision-making. As technology continues its relentless march forward, there’s a growing need for visualization tools and techniques that can encapsulate the dynamic nature of data.
Adopting new trends keeps visualizations current, engaging, and insightful for businesses and individuals. Let’s delve into some of the future trends in Data Visualization that are reshaping the way we look at data.
As we approach 2025, advancements in data visualization tools and techniques are making it possible to represent data in ways that are not only visually engaging but also highly insightful. From the rise of AI-driven insights to the power of AR and VR in creating immersive experiences, these trends hold significant promise for businesses and individuals alike.
Keep reading to learn how these data visualization trends and techniques will help you make smarter, faster decisions by transforming raw data into meaningful insights.
Learn more: Manufacturing Analytics: Insights for Smarter Operations
1. Augmented and Virtual Reality (AR/VR): Beyond the 2-D Space
Traditionally, data visualization was bound to two-dimensional spaces – think of bar graphs, pie charts, and scatter plots on paper or computer screens. However, the real world is three-dimensional, and many data relationships can be better understood when visualized in a similar context.
Immersive Visualizations
AR and VR enable users to step into the data, so to speak. Imagine navigating a 3-D scatter plot, with data points suspended in the space around you. By walking through this data landscape, users can perceive patterns and relationships that might remain hidden in a 2-D representation.
Augmented Reality on Mobile
With 5G’s low latency and high bandwidth, mobile AR visualizations will become more detailed and interactive. This enhances users’ ability to engage with and understand complex data on their mobile devices.
Holistic Understanding
Beyond just presenting data, AR and VR facilitate a comprehensive understanding. For instance, urban planners can visualize city infrastructural data in 3-D, overlaying it on real-world landscapes, allowing them to foresee potential challenges or advantages.
Read More: Manufacturing Inventory Management: What Really Works
2. AI-Driven Visualizations: Letting Machines Guide the Way
Data visualization, at its core, is about deriving insights. But with the sheer volume and complexity of contemporary data, manual analysis can be overwhelming.
Automated Insights
Artificial Intelligence (AI) has come to the rescue. AI-driven tools can sift through vast datasets, identifying crucial patterns, anomalies, and correlations. These insights can then be automatically visualized in the most effective and intuitive manner.
Think of it as having a virtual assistant that not only analyzes data but also recommends the best way to present it.
Personalized Visualization
AI’s adaptability means it can cater to individual preferences. For instance, a marketing manager and a financial analyst looking at the same dataset might need different visualizations to understand it best. AI can tailor visualizations based on the user’s role, requirements, and even past interactions.
3. Real-time Data Streams: The Dynamic Face of Data
Data is no longer static. It is continually being generated, updated, and revised. This dynamism has birthed the need for visualizations that can keep pace.
The IoT Revolution 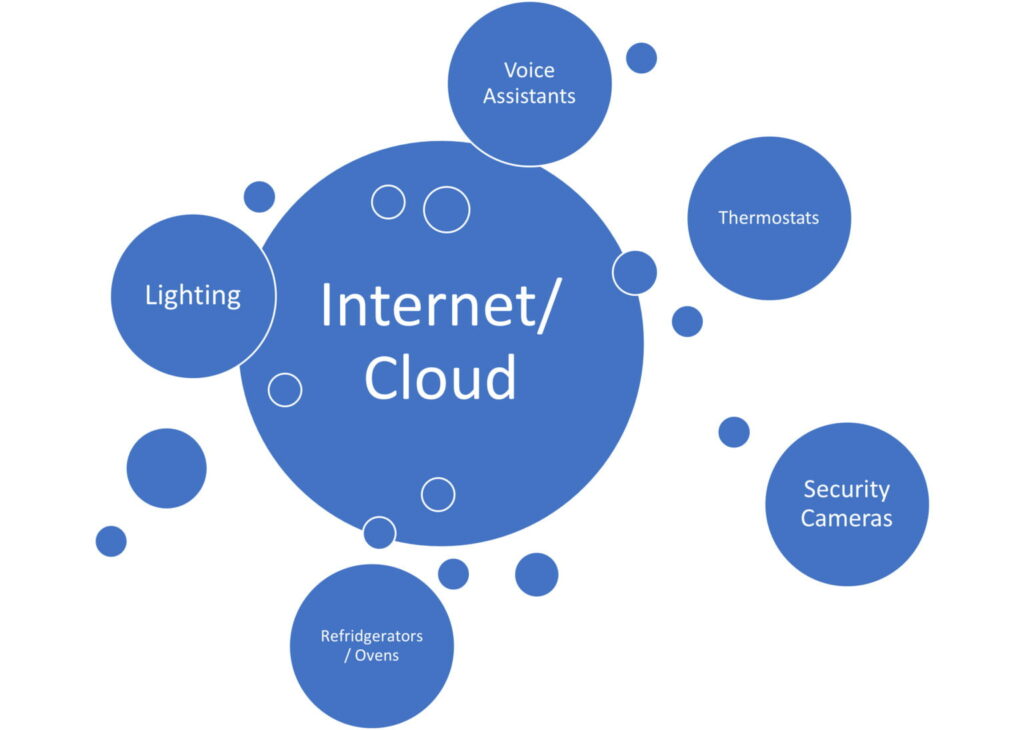
The Internet of Things (IoT) has exponentially increased the avenues from which data is sourced. From smart thermostats in homes to sensors in industrial equipment, these devices are continually transmitting data.
This interconnected web offers a treasure trove of real-time information that, when visualized, can provide invaluable insights.
Localized Data Processing
Edge computing involves processing data closer to the data source rather than in a centralized data center – this could be on a local device, sensor, or an edge server. As IoT devices proliferate, there’s a growing need for real-time data processing at the source.
For data visualization, this means faster, localized insights without sending data back and forth from centralized servers.
Decentralized Dashboards
In a world with edge computing, we might see decentralized data visualization dashboards tailored to specific locales or devices. For instance, a manufacturing unit might have its own dedicated visualization dashboard right on the shop floor, offering insights tailored to that specific environment.
Resilience and Reliability
By relying on localized data processing, edge computing also brings resilience to the visualization process. Network failures in a centralized server won’t necessarily disrupt the visualization processes happening at various edge nodes, ensuring that crucial insights remain accessible even in the face of technical disruptions.
4. Quantum Computing and Data Visualization
Processing Power and Speed
Quantum computers, with their unparalleled processing capabilities, have the potential to analyze and visualize vast datasets in a fraction of the time traditional computers take. As we enter an era of quantum computing, we can expect real-time visualizations of even the most intricate datasets.
Visualizing Quantum States
Quantum phenomena are inherently different from classical ones. With quantum computing’s rise, there might be a need for entirely new visualization techniques to represent quantum states and their interactions, making way for a new realm of quantum data visualization.
5. Neural Interface and Data Visualization
Direct Brain-Computer Interaction
Technologies are being developed to allow for direct interaction between the human brain and computers. In the realm of data visualization, this could lead to a user intuitively navigating and understanding data without the traditional interfaces like screens or VR headsets.
Emotion-driven Visualization
As neural interfaces can detect a user’s emotional state, there’s potential for visualizations that adapt based on the viewer’s emotions. If a particular data point or trend elicits confusion or curiosity, the visualization could automatically adjust or provide additional information to clarify.
Data Storytelling
Data storytelling is emerging as one of the most impactful trends in data visualization. This technique combines data visualization with narrative techniques to highlight key insights and trends in an intuitive, memorable way.
By weaving context and narrative into data presentations, companies can create experiences that resonate with their audiences, whether they’re making a business case, presenting research, or sharing customer insights.
This approach is changing how companies and individuals alike use data, transforming it into stories that drive action, build understanding, and foster emotional connections with audiences.
Data Democratization
Data democratization is an ambitious approach. It makes data accessible across an organization — not just to specialists. Traditionally, dedicated teams handled data. Now, democratization enables all departments to access insights.
Marketing, operations, and others can make data-driven decisions independently. This shift enhances productivity and speeds up decision-making.
It creates a more agile organization and builds a data-informed culture and sparks innovation.
6. Simplified User Interfaces
As data becomes central to every team’s workflow, a simple, accessible interface for data visualization is essential. When data tools are intuitive, they become usable by anyone. Even seasoned experts prefer streamlined tools that save time and reduce complexity.
Even experts value tools that save time and avoid complexity. A simple interface lets all departments, from HR to marketing, use data without confusion.
FileMaker exemplifies this trend in usability. Its intuitive design allows teams to view and act on data quickly. By keeping data accessible, simple interfaces build a data-informed culture.
This approach empowers fast, real-time decisions across the organization.
Mobile-First Design
With a mobile-first design, data becomes accessible anywhere. This flexibility supports quick, informed decisions from any location.
Whether in a meeting or on the go, mobile-optimized visuals let professionals check metrics instantly.
To make data visualizations work on mobile, keep design basics in mind. Mobile screens are small, and touch interaction is essential. This means each element must be simple and clear. Focus on the most vital data points, use readable fonts and prioritize graphic elements that are touch-friendly.
7. Interactive Data Visualization Is Also a Trend
Interactive data visualization is rapidly becoming a standard, moving far beyond a mere trend. Static charts are now incredibly limiting, leading to inefficiencies when searching for specific insights and making decisions.
Interactive charts, on the other hand, allow you to apply filters, cross-reference data, and precisely visualize numbers at every point on a graph.
The practical difference this makes is substantial. It’s one thing to see a stock’s value over time and decide you want to sell when it hits a certain point. It’s an entirely different experience to click directly on the chart to execute that sale when the stock reaches your desired threshold. The dynamism and efficiency offered by interactive tools are simply on another level.
Another common feature of interactive data visualization is animated data visualizations. These allow you to track the evolution of an indicator over time, significantly improving comprehension and understanding of the information presented.
8. Integrated Data Visualization Tools
Another key trend in data visualization for the coming years is the use of tools that allow non-data analysts to participate in the process. Often, the average professional within a company needs specific data combinations for presentations, analyses, or reports.
While tools like Power BI and Tableau are powerful, extracting and cross-referencing data from various sources can be overly complex and time-consuming for non-specialists.
This is precisely why the integration between company software and data visualization tools becomes so crucial. For example, Manufacturing Inventory Management: What Really Works, enabling much easier collection and cross-referencing of related data than through other means.
When non-data specialists can quickly and easily access data thanks to these integrations, their analyses and insights are enhanced, significantly boosting your company’s productivity.
Charting the Future of Data Visualization
In the rapidly evolving digital age, these data visualization trends are revolutionizing how we consume, understand, and represent data. From the immersive experiences afforded by AR and VR to the pinpoint accuracy and adaptability of AI-driven insights to the dynamic responsiveness of real-time data streams, the future of data visualization is multifaceted and holds immense promiseIn the rapidly evolving digital age, the manner in which we consume, understand and represent data is undergoing revolutionary transformations.
From the immersive experiences afforded by AR and VR to the pinpoint accuracy and adaptability of AI-driven insights to the dynamic responsiveness of real-time data streams, the future of data visualization is multifaceted and holds immense promise.
The integration of quantum computing pushes us towards previously unimaginable computational capacities, reshaping our expectations for speed and complexity. Meanwhile, the emergence of neural interfaces beckons a future where our very emotions and thoughts play a direct role in how we visualize and interact with data.
For individuals and businesses alike, embracing these innovations is not just an opportunity; it is essential. As data plays an increasingly central role in our decision-making processes, the tools and techniques we employ to visualize it will directly impact our capacity to derive meaningful insights.
In a world awash with information, our ability to comprehend and communicate this data will be the difference between being overwhelmed and harnessing its true potential. Stay informed, stay adaptable, and embrace the transformative power of next-generation data visualization.
Explore More on Data Analysis and Software Integrations with Codence!
Read more
Subscribe to get the latest in your inbox.

Built with you in mind
Speak to one of our expert consultants about making sense of your data today. During
this free consultation, we'll address your questions, learn more about your business, and
make some immediate recommendations.